
From the menu in the field on the left, go to “Analysis” to enter the “Dashboard,” where you can view the data analyses of users and messages. You can also view the rankings of popular modules in the past month. The following will explain the definition of each data title.
【BotBonnie’s Note】Go to the upper right corner of the screen to adjust the “User Type” and “Time Interval” you want to view. After adjustment, you can see the value of each indicator. In the upper left corner, you can also view “User Statistics” or “Message Statistics.”
Data from the six indicators in the “Dashboard”

1. Total Users: The number of all users who have interacted with the bot or have received messages from the bot before.
- Users who have blocked your bot are not counted.
- This number is not affected by the selected date range.
2. New Users: The number of users whose first interaction with the bot or the first message received from the bot happened during the selected date range.
3. Active Users in the Period: The number of users who have actively interacted with your bot during the selected date range.
- Here are some examples of active interactions:
- The user sends a message to the bot.
- The user clicks on a button in the module.
- The user comments under a post with the auto-reply feature.
- The user adds the LINE Official Account as a friend.
- Here are some examples of what does not count toward active interactions:
- The user receives a message from the bot.
- The user receives a comment reply from the bot.
- The user reacts to bot messages with emojis.
【BotBonnie’s Note】
◆ It’s possible for the number of active users to exceed the number of total users. If users blocked your channels outside of the selected date range, these blocked users will be included in the active users count, but not in the total users count. This is because the selected date range is not applied to total users.
◆ Receiving a LINE targeted broadcast counts as an active interaction, while receiving other types of broadcast does not count toward active interactions.
4. Broadcast Users: The number of users who have received your broadcasts during the selected date range.
5. Block Users: The number of users who blocked the LINE Official Account during the selected date range. This data is available for LINE only.
6. Total Messages: The number of messages the bot sent to and received from users during the selected date range.
Message calculation example:
In the case of the message in the following figure, a bubble represents one message; there are 4 messages in total.
They include: The bot “replies One Module”; the bot “Broadcasts Three Modules.”

【BotBonnie’s Note】The percentage next to each data set represents the growth or decline trends as compared with the previous time interval.
The block in the lower left corner of the “Dashboard” represents the “User Growth in 7 Days” line chart.
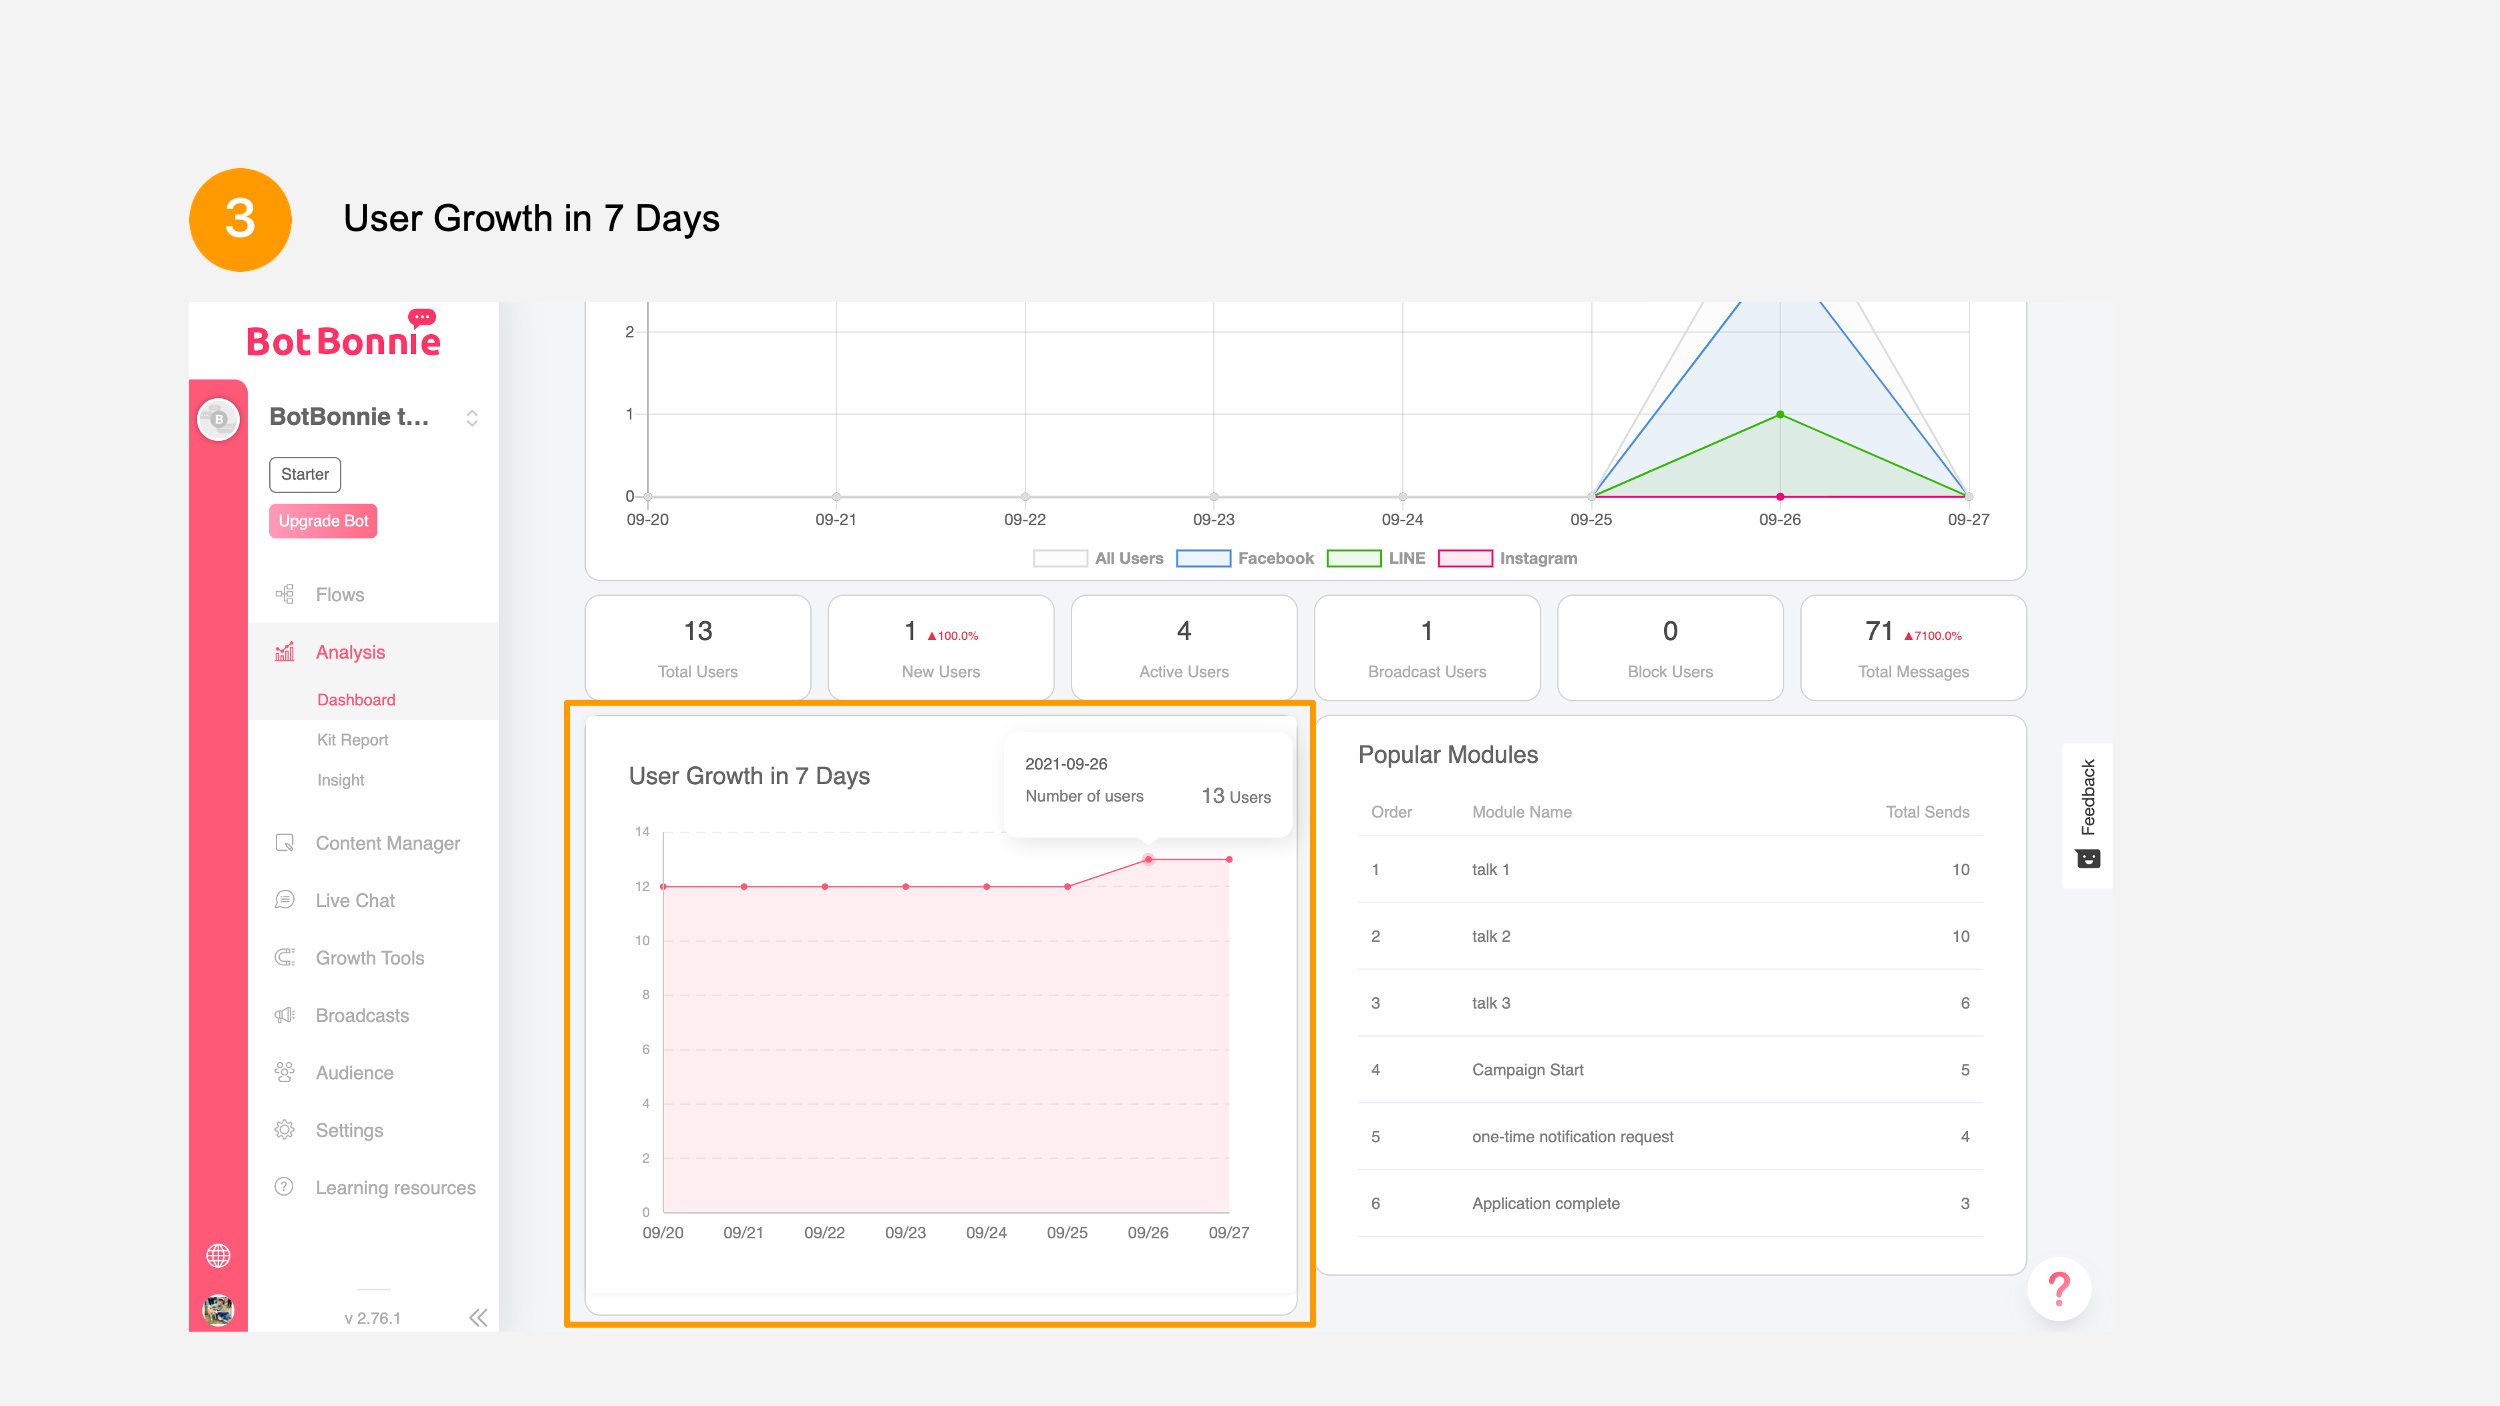
The block in the lower right corner of the “Dashboard” represents the data of “Popular Modules in the Past Month.” The “total number of times sent” represents the total number of times that the module message was sent from the bot to the user.

【BotBonnie’s Note】[Total number of times sent] ÷ [number of replies contained in this module] = The number of times the entire module has been sent, which is closer to the number of users who have received messages from this module.
